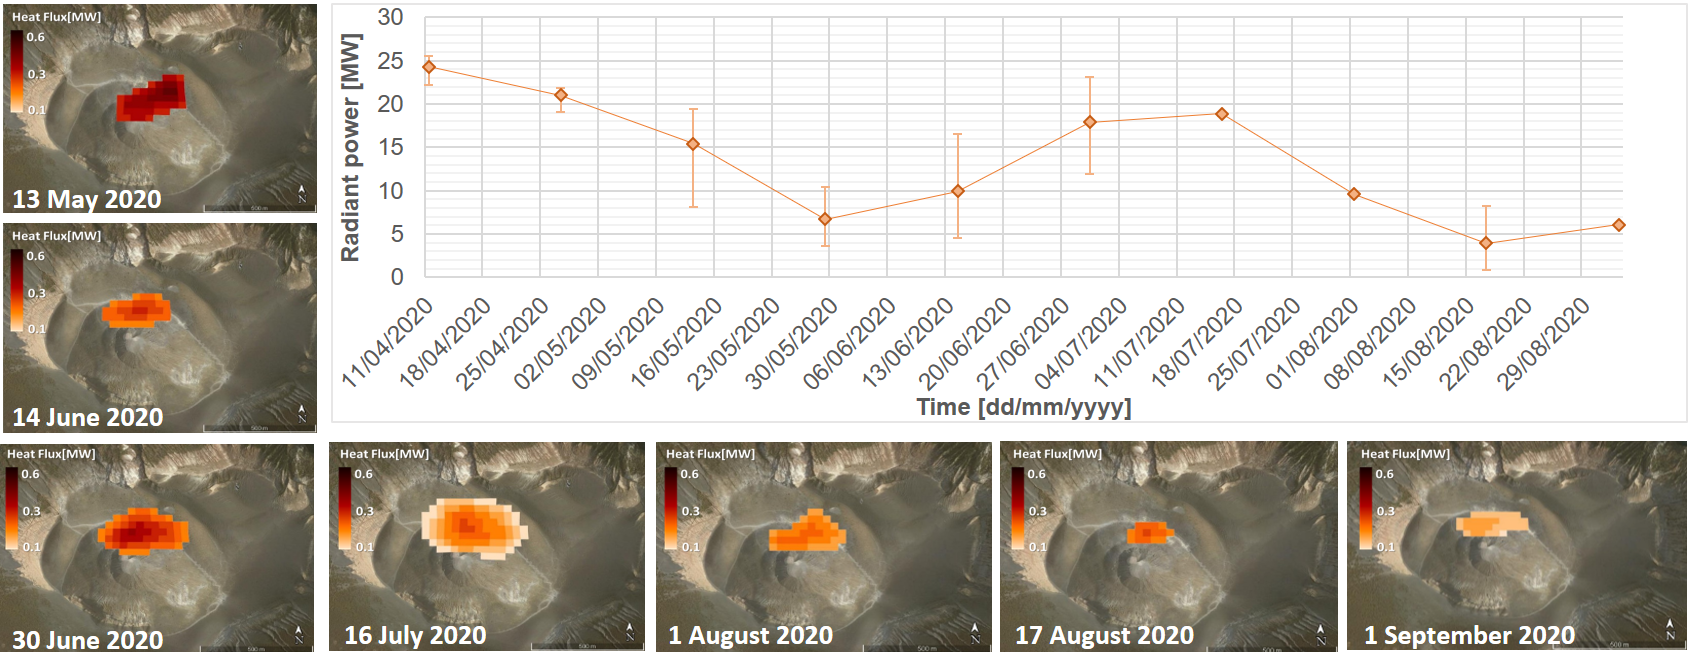
Volcanic Radiative Power (VRP)
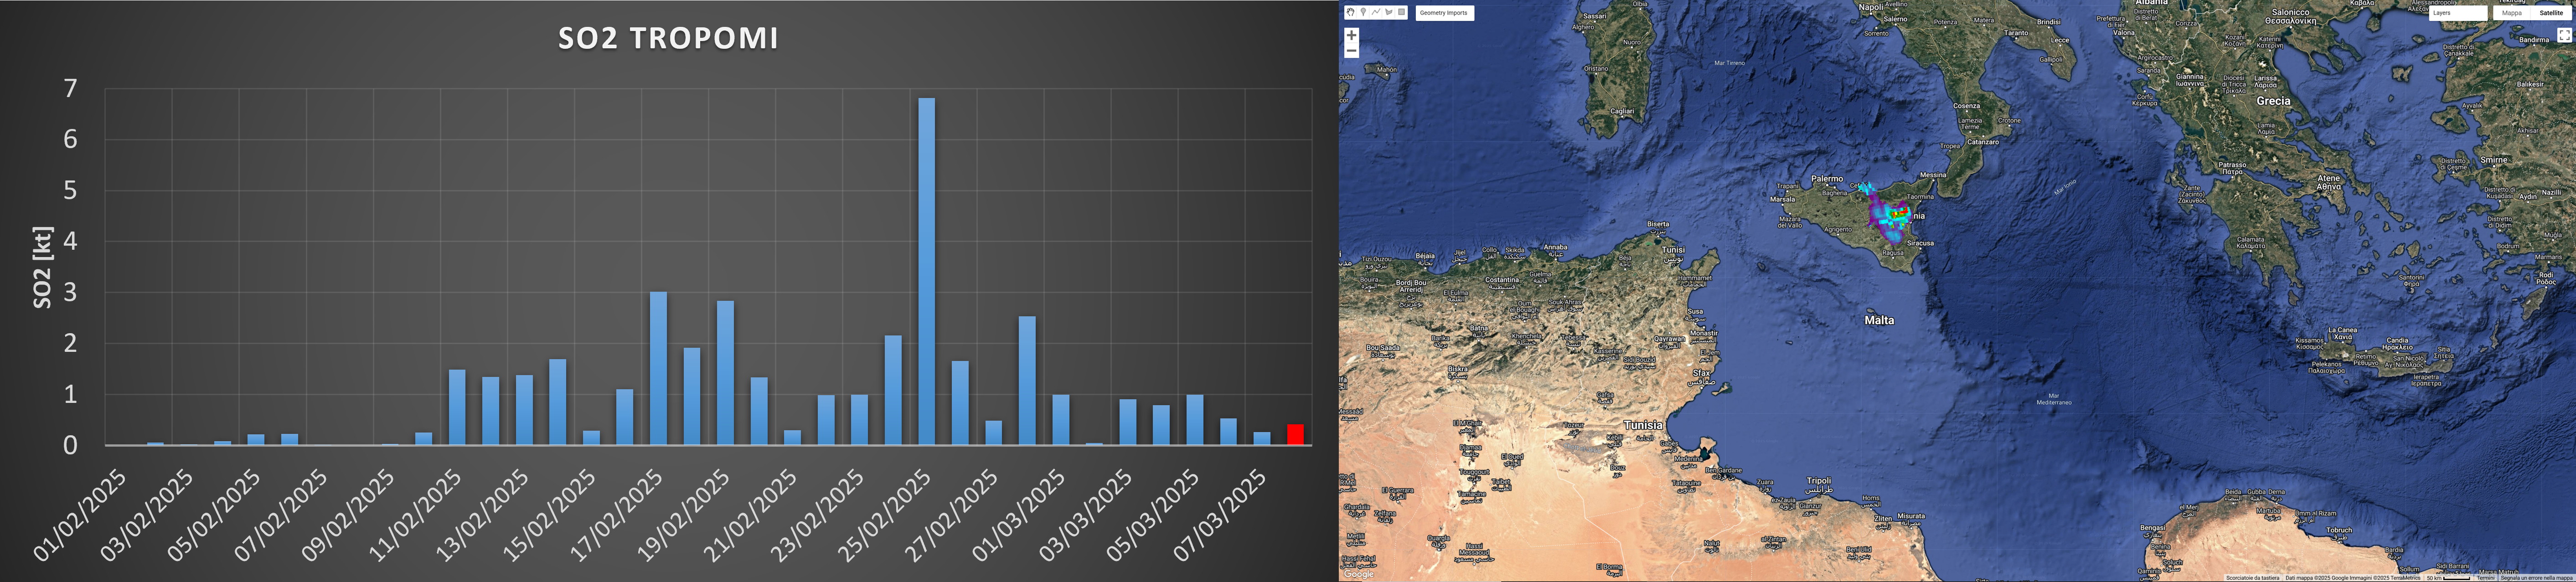
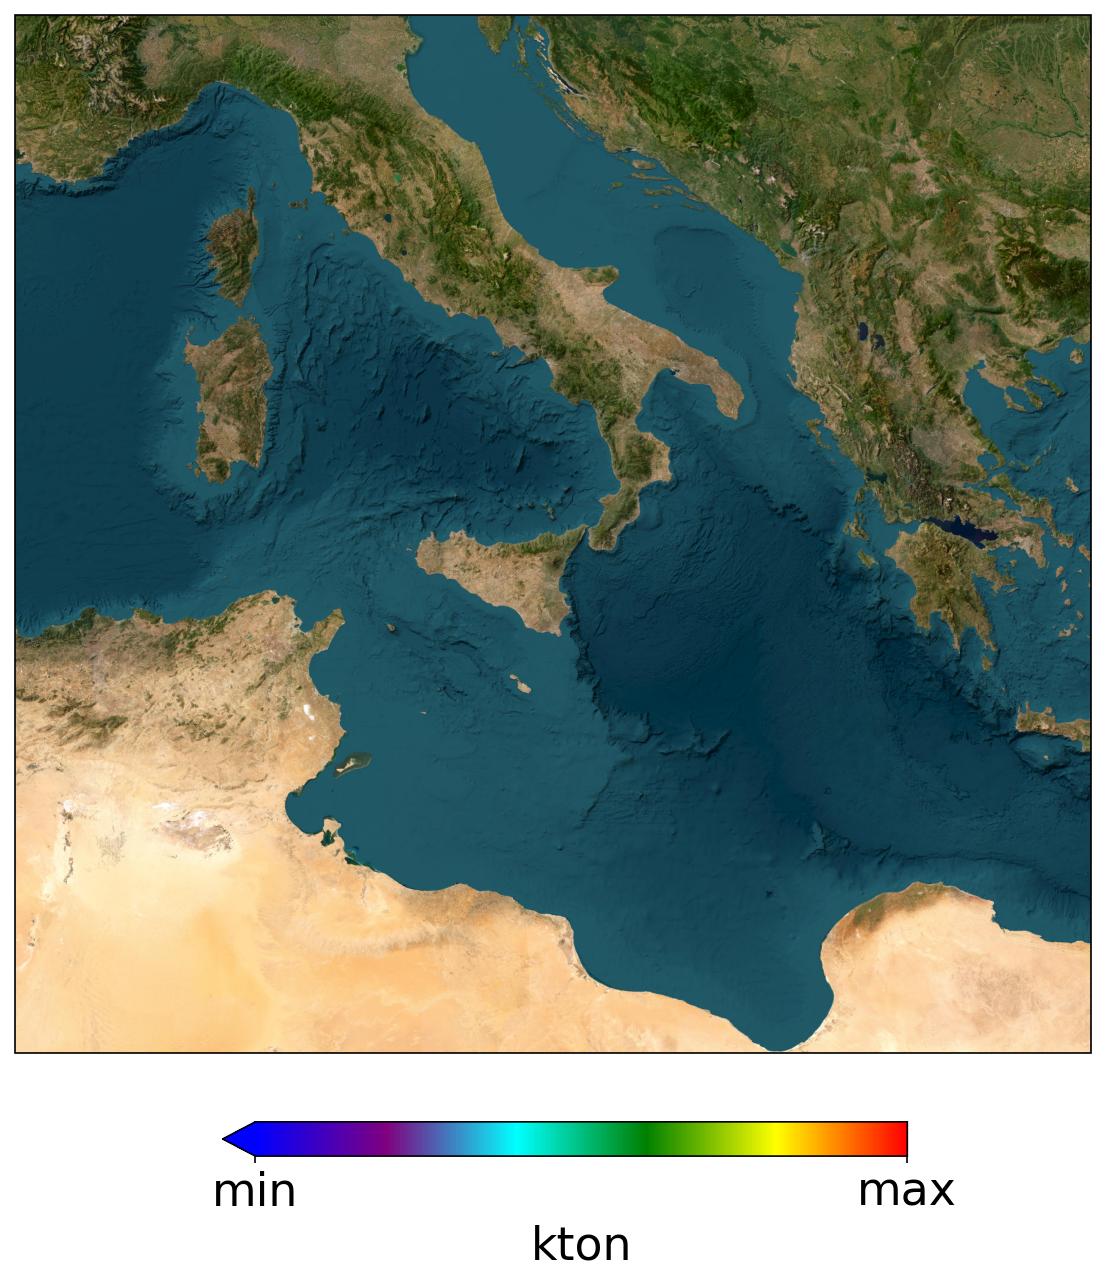
SO2 Emissions
Measurements of sulfur dioxide (SO2) emissions from TROPOMI [kt] 27/07/2026
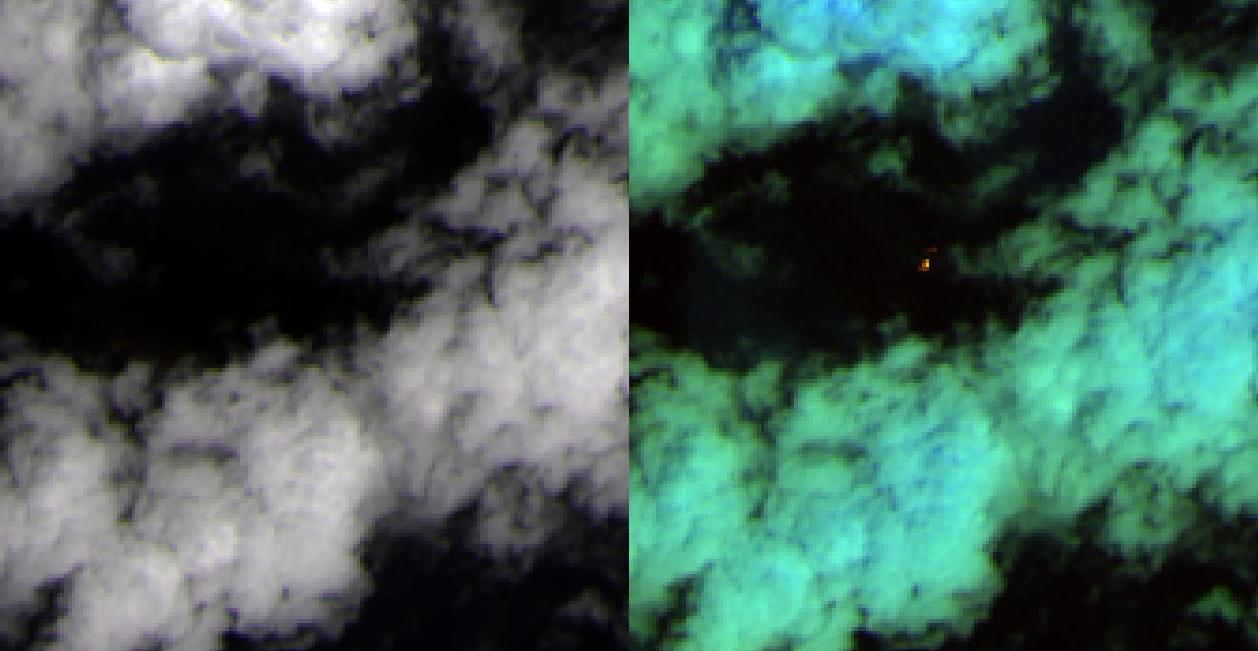
Thermal Activity

Sentinel-2 MSI
27/07/2026
Cloudy
The thermal activity of Etna has been monitored through the processing of a variety of satellite images with different temporal, spatial, and spectral resolutions. The Figure shows the estimates of radiant power of the last 6 months, calculated using FCI, SEVIRI, MODIS, VIIRS, and SLSTR multispectral images.
In the past week, the thermal activity in the summit area was moderate. The maximum thermal flux anomaly is 4.12 MW (FCI), recorded on 2026-07-25 05:50:00 UTC.
The latest thermal flux anomaly (0.9 MW, VIIRS) was recorded on 2026-07-28 00:54:00 UTC. However, in the past week, poor weather conditions have often affected the analysis of satellite images.
This project is powered by Google Earth Engine, which enables large-scale processing and analysis of satellite data.